The debugger mouse (intuitive debugging with the mouse)
As with the ten-finger system on the keyboard, there is a point where a developer doesn't think about step-in, step-over or step-out. It becomes an intuitive process, (s)he thinks "I want to go there", and the correct keys are pressed to go there. But what happens if we have to work with different development environments and they have different shortcuts? This are two very common schemes, note the inverse order of the keys (left/right):
| Command | VisualStudio/JavaScript | Delphi/PyCharm |
|---|---|---|
| Step-In | F11 | F7 |
| Step-Over | F10 | F8 |
| Step-Out | shift F11 | shift F8 |
Switching between different IDEs absolutely breaks the intutiveness and the flow of debugging, suddenly I have to think about "which language am I in?" instead of "I want to go there". How nice it would be to have the same workflow in every environment!
A gamer mouse to the rescue
Since beginning of time gamers are doing it, they map their preferred setup to the current game, and this is what I do also with my programming IDEs. A gaming mouse doesn't need to be expensive and most of them allow to map shortcuts individually to the buttons.
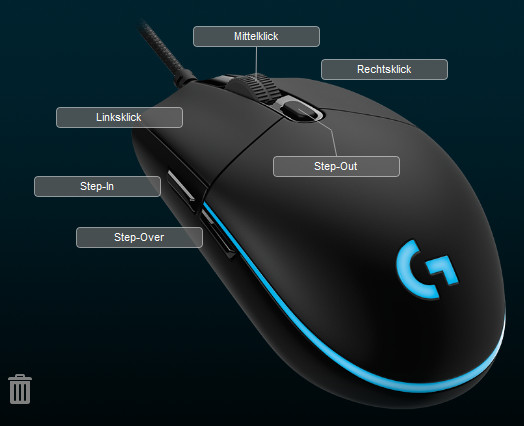
This is my setup for debugging, Step-In and Step-Over on the side buttons, Step-Out on the top. The picture shows the software for a Logitech G203.
- One profile can be stored on the mouse itself, so it can be taken along to another computer without having to install the software there.
- The installed software can detect the active process and switch the profile for every running program. So we can always have the matching shortcuts on the accustomed buttons.